
In Dynamics CRM 2013 charts you can drill down/drill up data to access deeper levels of analysis. Here is how to do it simply in 2 steps:
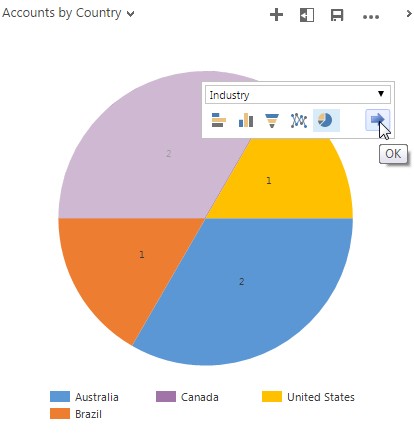
Let’s take an example of a pie chart of accounts by country:
Step1: Click on any sector to drill down, choose a field and a chart type then click OK(arrow icon)
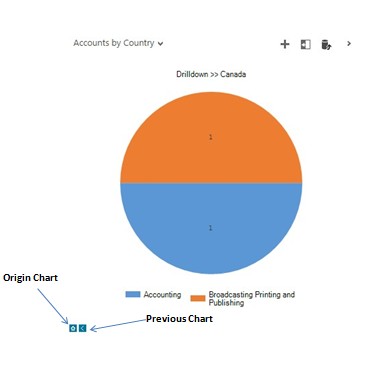
Step2: Clicking on Canada’s sector and choosing Industry as a new dimension will create a new chart of Canada’s accounts by Industry. You can drill up by clicking on the previous button or drill down further by following the same method and so on.
Hope it helps!
